
Channel A went live 12 weeks ago. Channel B went live three weeks ago. At this month's board review, A has closed £30,000 of revenue and B has closed nothing, and someone suggests moving B's budget to A.
That comparison is unfair. A's first leads are 84 days old and B's are 21. A has had four times as long to move through your pipeline, so the tally mixes differences in time available to progress with any differences in lead quality or other conditions.
The fix is a simple form of B2B marketing cohort analysis: compare each channel's leads at the same age, not on the same reporting date. We call the result the pipeline maturity curve. It tells you when two numbers are fairly comparable and which are still immature. It does not show that either channel caused a sale, and it makes no promise that B will catch up.
The two clocks
Every pipeline report runs on two clocks. The calendar clock is the reporting date: this month, this quarter, as of Friday. The cohort clock is age: the days since a group of leads entered your pipeline. A cohort is a group of leads acquired in one window from one channel, such as Channel A's first week, and its start event is the timestamp that admits a lead to it, such as lead created.
Dashboards read the calendar clock. A fair channel comparison needs the cohort clock.
Scroll the diagram horizontally on a small screen, or read the matched-age summary below.
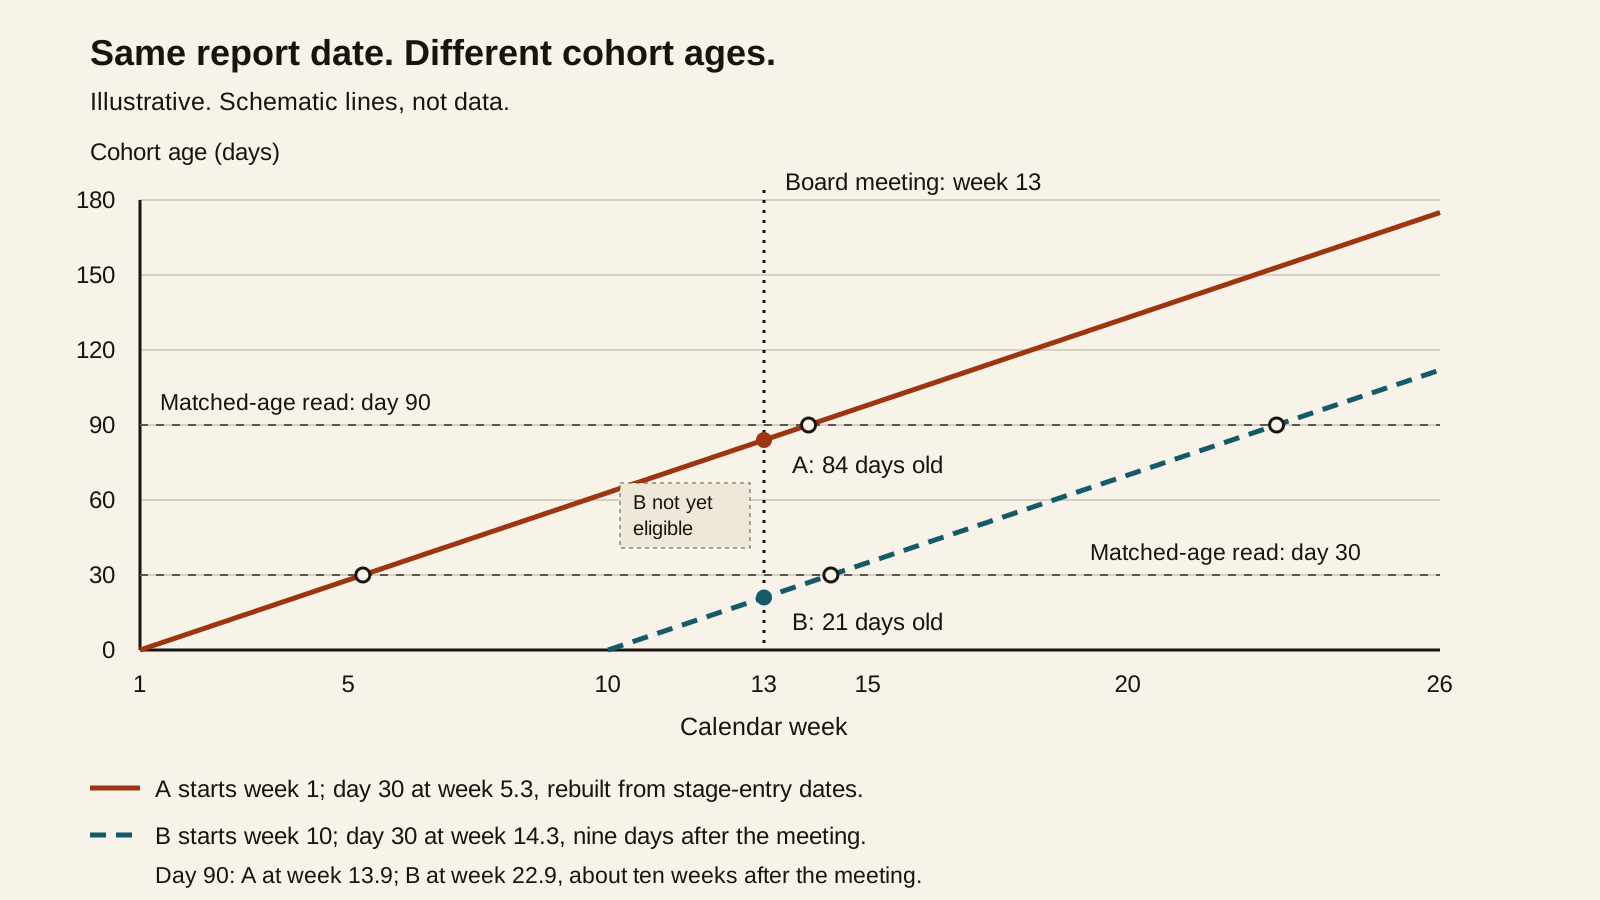
- Week 13 board meeting: A is 84 days old; B is 21.
- Matched day 30: A at week 5.3, rebuilt from history; B at week 14.3, nine days after the meeting.
- Matched day 90: A at week 13.9; B at week 22.9, about ten weeks after the meeting. B is not yet eligible for either read at the meeting.
Our Weekly Acquisition-Economics Scorecard warns against comparing mismatched cohorts and reporting periods. This guide shows how to fix that. For what to measure, see How to Measure a Rewards-Based Campaign.
A worked example: the apparent winner changes as the evidence matures (hypothetical)
Every number in this section is hypothetical. It is not Zenko or client data and it is not a benchmark.
The set-up
- Channel A went live in week 1 and Channel B in week 10. The board meets in week 13.
- Each channel's cohort is the leads it created in its first week: 200 for A and 120 for B. Spend is £20,000 for A and £12,000 for B, so both cost £100 per lead. The denominator is acquired lead records throughout, not unique accounts. For this illustration, each lead can receive credit for at most one accepted opportunity; an account's opportunity is credited once to its first acquiring channel.
- To keep the example readable, age is measured from one date per cohort. In practice, measure from each record's own start event.
- Finance and RevOps agreed these rules in advance:
- a cohort needs at least 100 eligible leads before an allocation read;
- accepted-opportunity reads are decision-ready at day 90, and won revenue is read at day 180 because the sales cycle is long;
- an observed gap of 5 points or more in acceptance rate reopens the allocation decision (an invented threshold for this example);
- spend ceilings and early-warning checks (working tracking, invalid or duplicate leads, leads rejected at first sales review) can trigger a cap or pause at any age.
- Average opportunity value is assumed to be £18,000, so pipeline value is accepted opportunities multiplied by £18,000.
Read 1: the calendar clock says A is winning
On a small screen, scroll the table horizontally to read all columns.
| On the week 13 report date (hypothetical) | Channel A | Channel B |
|---|---|---|
| Went live | Week 1 | Week 10 |
| Cohort age | 84 days | 21 days |
| Revenue closed this month, from all of the channel's leads | £30,000 | £0 |
A closed £30,000 and B closed nothing. But A's cohort is 84 days old and B's is 21. This read rewards age.
Read 2: rebuild both channels at day 30
B's cohort reaches day 30 nine days after the meeting. A passed day 30 long ago, so A's day-30 position has to be rebuilt from its stage-entry dates. Reading A's current totals instead would credit it with more than 60 further days of progress that B has not had.
On a small screen, scroll the table horizontally to read all columns.
| Day 30 (hypothetical) | Channel A | Channel B |
|---|---|---|
| Eligible leads | 200 | 120 |
| Spend | £20,000 | £12,000 |
| Accepted opportunities | 16 | 12 |
| Acceptance rate | 8.0% | 10.0% |
| Cost per accepted opportunity | £1,250 | £1,000 |
| Pipeline value | £288,000 | £216,000 |
| Won deals | 0 | 0 |
Now B looks ahead. The observed difference is +2.0 points for B, and the 95% interval for that difference runs from -4.2 to +9.3 points. The data are compatible with B being worse, the same or better. That interval describes the uncertainty in the difference. It is not a test, and we do not use it as one. These illustrative intervals assume independent lead-level outcomes. If leads are clustered within accounts, use an analysis that accounts for that dependence; the simple interval does not.
Day 30 is also below the agreed age for opportunity-stage reads, so the state is immature for allocation. Do not move budget on this read. Put the day-90 read in the diary for about ten weeks after the board meeting.
Waiting for the allocation is not waiting for everything. Immature means the allocation decision waits for the evidence. The safeguards do not. The ceilings and early-warning checks agreed in advance still apply, and here they all hold. Had B's tracking been broken, or most of its leads been rejected at first review, you would cap or pause it now, because those problems show up in days, not months. A pause is a risk control, not a verdict on the channel.
Read 3: both channels at day 90
On a small screen, scroll the table horizontally to read all columns.
| Day 90 (hypothetical) | Channel A | Channel B |
|---|---|---|
| Eligible leads | 200 | 120 |
| Spend | £20,000 | £12,000 |
| Accepted opportunities | 30 | 18 |
| Acceptance rate | 15.0% | 15.0% |
| Cost per accepted opportunity | £666.67 | £666.67 |
| Pipeline value | £540,000 | £324,000 |
| Won deals (revenue) | 4 (£48,000) | 2 (£24,000) |
The day-30 gap has closed. The observed difference in acceptance rate is 0.0 points, below the agreed 5-point threshold. The 95% interval for the difference is -7.7 to +8.6 points, wide enough that a gap beyond the threshold in either direction cannot be ruled out.
Age, sample size and data checks have all been met, so the opportunity-stage read is decision-ready. That means it is mature enough to act on, not that it proves the channels are equal. The action it supports is no reallocation on acceptance rate, with the width of that interval as the caveat. Narrowing uncertainty at day 90 requires more eligible observations, such as larger or additional comparable cohorts measured at the same age. Following these same leads for longer measures a different, later-age outcome; it does not add observations to their fixed day-90 read.
Won revenue is not yet decision-ready. The agreed read age is day 180, and four deals against two cannot support a conclusion. Report the figures, mark them pending and do not calculate a return on spend from them.
Read 4: a restatement
When B's cohort reaches day 120, a CRM clean-up merges duplicate accounts. RevOps finds that 4 of B's 18 accepted opportunities sit in accounts that A's cohort had already brought into pipeline. Under the agreed rule, which credits each account once to the first channel, they count for A, where they were already counted.
This corrects opportunity credit, not the acquired-lead count: B still acquired 120 lead records. If the clean-up also removed duplicate lead records, the denominator and all dependent rates would need a separate restatement. Here B's day-90 read restates to 14 of 120, or 11.7%. The difference from A is now -3.3 points (95% interval -10.6 to +4.8), still below the 5-point threshold, and cost per accepted opportunity becomes £857.14. The decision not to reallocate stands, but the record now shows the restated read, the date and the reason.
What the example shows
- Acting on the calendar read would have cut B. Acting on the day-30 read would have favoured B. The day-90 read supports neither move.
- Fairness needed reconstruction. Comparing today's totals would have set 84 days of A against 21 of B. Rebuilding A's day-30 position from stage-entry dates is what made the comparison fair.
- Stages mature at different ages. Opportunity creation was readable at day 90. Won revenue was not.
Build the same table from your CRM
Five choices decide whether an age-matched table can be trusted. Write them down before you count.
On a small screen, scroll the table horizontally to read all columns.
| Choice | What to settle |
|---|---|
| Start event and time zone | The one timestamped event that starts a lead's clock, such as lead created, first meeting booked or account first touched, in one stated time zone |
| Channel attribution rule | One rule that assigns each record to one channel, applied the same way to every cohort |
| Accepted-opportunity stage | The stage that counts and who accepts it, ideally the one in your lead qualification framework |
| Stage-entry dates | The date each record first entered each stage, and which date counts if it re-enters a stage. A current-stage field cannot supply these |
| Unit | Leads, accounts or opportunities, and how an account touched by several channels is credited once. Do not switch denominators mid-report |
Then build the table in five steps:
- Bucket by acquisition week or month, and by source.
- Choose age bands. Day 7, 30, 60 and 90 are a reasonable start for multi-week sales cycles. They are illustrative, not a standard, so set yours from your own observed lag. Your median could be 30 days or 300.
- Count only cohorts old enough. Write "not yet eligible", never zero. Zero means nothing happened. Not yet eligible means the cohort has not yet reached the selected observation age.
- Count cumulatively. With fixed definitions and no restatement, cumulative counts cannot fall. A dip needs investigation: stage dates may have been overwritten, or a documented correction may have restated earlier counts.
- Keep outcomes separate. Show spend, eligible leads, accepted opportunities, pipeline value and won revenue as separate observed measures, with any forecast in its own labelled column. Show counts beside every rate and agree a minimum cohort size first.
Lenders have compared loans at the same age on book for decades. The US Office of the Comptroller of the Currency calls it vintage analysis. Google Analytics 4 has a cohort exploration report built on a similar idea, but it groups users by device data and ignores User-ID, so it does not replace opportunity cohorts built in your CRM. The method here is our own editorial framework, not a standard.
Check that your CRM stored the dates
The day-30 rebuild in the example needs stage-entry dates. A current-state export shows where each record is today, not when it got there, and you cannot reconstruct the path from it.
On a small screen, scroll the table horizontally to read all columns.
| CRM | What the documentation says | Condition |
|---|---|---|
| HubSpot | Stage properties such as date entered and time in stage are populated retroactively from existing data (HubSpot documentation, updated July 2026) | Plan and object restrictions apply; lead-stage properties require Service Hub Professional or Enterprise. Off by default for new pipelines and stages |
| Salesforce | Enable tracking for the relevant fields before relying on recorded changes; standard history retention is 18–24 months (Salesforce Help) | Field Audit Trail can archive for longer but is not retroactive (Salesforce guide). Check which fields are tracked |
| Other CRMs | Check your vendor's documentation | Not covered here |
If there is no history, a cruder current-state comparison is the most you can do. Start capturing stage-entry dates, or take a weekly snapshot of the pipeline, today.
What changes in your decision record when cohorts differ in age
Label every read with one of three states: immature (not enough time or data), decision-ready (the pre-agreed age, sample size and data checks have passed) or restated (late updates, merges or corrections changed an earlier read). Thresholds belong to you, set with finance and RevOps. They are not Zenko benchmarks.
You do not need a new template. Keep your usual decision record, with its owner, review date and sign-off, and change these fields. For thresholds and when to hold or change spend, see our Paid-Growth Saturation Test.
On a small screen, scroll the table horizontally to read all columns.
| Field | What changes when cohorts differ in age |
|---|---|
| Cohorts and age read | Name the age both cohorts are read at, not the report date. Mark any cohort that has not reached it as not yet eligible |
| Read-ready date | Add the date the younger cohort reaches the agreed age. The allocation decision waits for it |
| State by stage | Label each stage separately. Opportunity creation can be decision-ready while won revenue is still immature |
| Early-warning limits | Record the spend ceiling and the early signals that allow a cap or pause before the read-ready date |
| Restatement log | Keep the original read, the restated read, the date and the reason |
| Reversal trigger | State, before you look, the size of difference that would reopen the decision. Do not use overlapping intervals as the trigger, because they are not a test |
What age matching does not do
Age matching answers one question: are these two numbers fairly comparable? It does not show that either channel caused a sale, repair a weak attribution rule, remove differences in who each channel reaches, forecast won revenue without calibration against older cohorts or make a small cohort reliable. How to Measure a Rewards-Based Campaign covers attribution versus causation, small samples and observation windows, and the same logic applies to channel comparisons.
Three next steps depend on what is wrong:
- A holdout or geo test, when the decision is large and your volumes allow it.
- A CRM clean-up, when stage dates are missing, overwritten or inconsistent.
- A longer window, when cohorts are young, with your safeguards running while you wait.
Your first step this week
- Export channel costs by week, and anonymised leads with created date, source and the date each stage was first entered. Remove names, email addresses and company details.
- Pick one age band, such as day 30, and two channels.
- Count only cohorts old enough to have reached it, and mark the rest not yet eligible.
- Label each read immature, decision-ready or restated, and write down the date the younger cohort becomes readable.
Before you move budget between two channels, check that you are comparing cohorts at the same age. If you are not, set the date the comparison becomes fair, and keep your risk controls running until then.
Related guides
- The Acquisition Economics Playbook explains how cost per lead, cost per qualified lead and customer acquisition cost relate.
- The Weekly Acquisition-Economics Scorecard gives a periodic view of those costs.
- How to Measure a Rewards-Based Campaign covers what to measure.
- The Paid-Growth Saturation Test covers when to hold or change spend.
- The lead qualification framework helps sales and marketing agree what counts as an accepted lead.
More on this topic is in Growth and Acquisition.
If you are working through this measurement problem and want to talk it over, you can get in touch.
Related rewards-based campaign guides
These cover reward design and controls, rather than the timing of channel comparisons:
- Rewards-based marketing
- Choose the customer action to reward
- Prevent reward farming
- Incentive marketing examples
Frequently asked questions
What is a marketing cohort?
A marketing cohort is a group of leads, accounts or customers that share a start event within a defined window, such as everyone who became a lead from one channel in one week. You follow the group over time to see what it does next.
What does cohort age mean in B2B pipeline reporting?
Cohort age is the time since a cohort's start event, usually counted in days or weeks. A cohort whose leads arrived 30 days ago is 30 days old, whatever today's date. Comparing cohorts at the same age removes differences in time available to progress. Differences in lead mix, sales handling, market conditions and other confounders remain.
How do I compare channels with different sales-cycle lengths?
Compare each channel's cohorts at the same age, such as day 30 or day 90, and only where each cohort is old enough to have reached it. Rebuild the older cohort's position at that age from stage-entry dates instead of reading today's totals, and show counts beside every rate.
What do I do when only one cohort has reached day 90?
Treat the read as immature for allocation. Compare the younger cohort only at ages both have reached, such as day 30, and set the date it reaches day 90. Keep your safeguards running: cap or pause spend now if early signals such as broken tracking, invalid leads or a breached spend ceiling appear.
Does a maturity curve prove incremental customers?
No. A matched-age comparison is descriptive: it shows whether two numbers are fairly comparable, not whether the channel caused the sales. Showing cause takes a controlled test such as a holdout or geo test, which B2B volumes can make difficult.
Can I use the method without stage history?
Only partly. A current-state export shows where each record is today, not when it got there, and you cannot reconstruct stage transitions from it. First check whether your CRM already stores history: HubSpot can populate stage-date properties from existing data on some plans, and Salesforce keeps tracked field changes only from the date tracking was switched on. If there is none, make a cruder current-state comparison and start capturing stage dates now.
When should you reallocate marketing budget?
When the cohorts you are comparing have reached the same pre-agreed age, meet the agreed sample size and pass data checks, and the observed difference is large enough to act on by a threshold you set beforehand. Until then, hold the allocation decision but not the safeguards.
Sources
References consulted 4 October 2026. CRM retention and plan requirements can change; confirm the current documentation for your account before implementation. Age bands, thresholds and the worked example are editorial illustrations, not benchmarks.
- Google Analytics Help, Cohort exploration
- Office of the Comptroller of the Currency, Comptroller's Handbook, Asset Securitization (1997)
- HubSpot Knowledge Base, Use stage calculated properties (updated 15 July 2026)
- Salesforce Help, Field History Tracking Overview
- Salesforce, Field Audit Trail Implementation Guide
- Newcombe, Interval estimation for the difference between independent proportions: comparison of eleven methods, Statistics in Medicine 17:873 to 890, 1998 (the interval method used for the differences in the worked example, as cited in the Epi package documentation)